Most traders draw lines… but the best traders identify zones. If you're just getting started, learning to read where price is likely to react can be the difference between consistent profits and constant confusion.
This guide will walk you through how I personally spot the areas that matter, how to avoid common mistakes, and how to gain confidence in your charting.
🧱 What Are Trade Zones, Really?
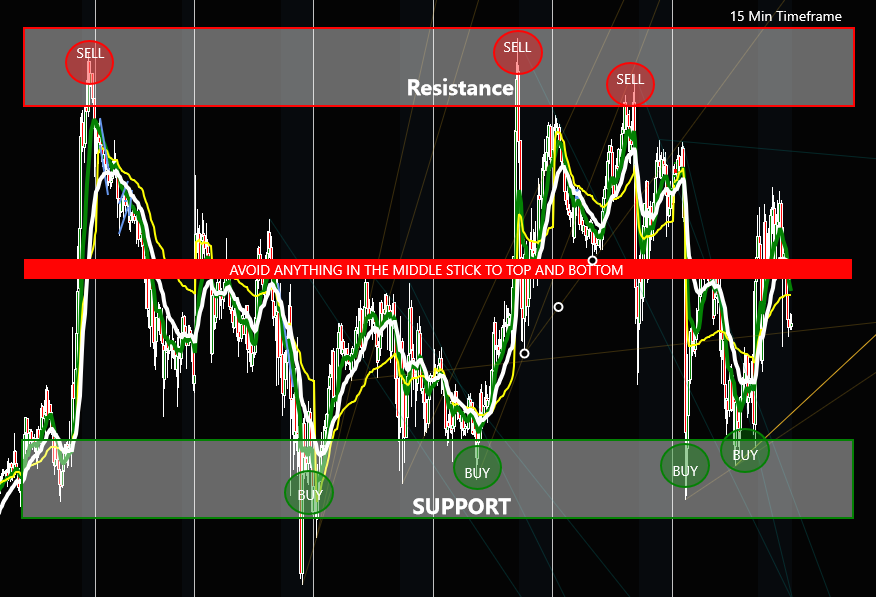
Support and resistance aren't magical price points. They're areas on the chart where buying or selling pressure has shown up before — and could show up again.
These zones represent where decisions are being made. When price enters one of these areas, traders step in, and that's where opportunity lives.
🗒️ Think of zones like battlegrounds. You’re not predicting exactly where the market will turn — you’re identifying where a reaction is likely.
📍 Step 1: Map Out the Reaction Zones
Instead of trying to nail a single price, look for clusters of price action where candles reverse, stall, or wick repeatedly. These are high-interest areas where the market has previously made up its mind.
What to look for:
Price touching an area multiple times
Sharp reversals or long wicks
Gaps, spikes, or consolidations
🔑 Key Principle: Zones = Ranges, not lines. Give price room to "breathe" without triggering your stop too early.
📈 Step 2: Focus on Market Turning Points
The most reliable zones appear at clear market extremes — major highs and lows where price becomes stretched and participants get emotional.
Don’t get caught up in every minor dip or bump. Zoom out. Ask:
Where has price snapped back hard?
What areas marked the start of big moves?
These are your high-potential setups.
🕒 Step 3: Let Price Confirm the Zone
Many traders jump the gun. They see price hit a level and enter immediately. Instead, wait for price to show you it respects that zone.
🔄 Step 4: Analyze the Reaction, Not Just the Level
It’s not enough to know where price bounced — you also need to pay attention to how it bounced.
Did price get aggressively rejected with momentum? Or did it drift away slowly?
Fast rejections = strong zone
Weak drifts = questionable zone
The intensity of the bounce tells you how much interest is behind it.
🧭 Step 5: Cross-Check with Higher Timeframes
If you’re trading on a lower chart (1-min, 3-min), those levels are often noisy. That’s why I build all my zones using higher timeframes first — then drill down for entries.
Try this:
Mark zones on the 15-min chart
Refine on the 5-min
Execute on the 1-min or tick chart
This gives you the context to avoid random trades and focus only on the cleanest opportunities.
⚠️ Mistakes New Traders Make with Zones
Let’s talk about what not to do. These common traps will throw off your entire strategy:
Over-marking the chart – Every wiggle isn’t a reversal. Less is more.
Ignoring failed zones – If a level breaks cleanly, it's no longer valid. Adjust.
Chasing price – If you missed the bounce, don’t enter late. The zone did its job. Move on.
Stay disciplined. Good zones = fewer, stronger trades.
📊 Practice Exercise: Build Your Charting Confidence
Try this today:
Pull up a clean chart (no indicators).
On the 15-min timeframe, draw 3-5 zones where price reversed clearly.
Drop down to the 1-min or 3-min chart.
Watch how price behaves around those zones in real-time.
No trading — just observation. This builds instinct.
🚀 What Comes Next?
Support and resistance zones are just the beginning. Once you master identifying key areas, the next step is building trade setups that combine:
Entry signals
Risk management
Leverage and scaling strategies
In my next lesson, I’ll walk you through how to trade with confidence on a small account by using smart leverage and momentum-based entries.
🧠 Final Thought
You don’t need to predict the future — you just need to recognize where the market might react, then wait for confirmation.
Trading is part art, part science. The more you refine your ability to spot clean zones, the more clarity you'll have in chaotic markets.
You can lose money trading. Nothing I say should be considered trading advice. I am not a licensed financial expert.
The information contained on this website is solely for educational purposes, and does not constitute investment advice. The risk of trading in securities markets can be substantial. You must review and agree to our Disclaimers and Terms and Conditions before using this site. U.S. Government Required Disclaimer – Commodity Futures Trading Commission. Futures and options trading has large potential rewards, but also large potential risk. You must be aware of the risks and be willing to accept them in order to invest in the futures and options markets. Don’t trade with money you can’t afford to lose. This website is neither a solicitation nor an offer to Buy/Sell futures or options. No representation is being made that any account will or is likely to achieve profits or losses similar to those discussed on this website. The past performance of any trading system or methodology is not necessarily indicative of future results. Individual results may vary, and testimonials are not claimed to represent typical results. All testimonials are by real people, and may not reflect the typical purchaser’s experience, and are not intended to represent or guarantee that anyone will achieve the same or similar results. CFTC RULE 4.41 – HYPOTHETICAL OR SIMULATED PERFORMANCE RESULTS HAVE CERTAIN LIMITATIONS. UNLIKE AN ACTUAL PERFORMANCE RECORD, SIMULATED RESULTS DO NOT REPRESENT ACTUAL TRADING. ALSO, SINCE THE TRADES HAVE NOT BEEN EXECUTED, THE RESULTS MAY HAVE UNDER-OR-OVER COMPENSATED FOR THE IMPACT, IF ANY, OF CERTAIN MARKET FACTORS, SUCH AS LACK OF LIQUIDITY, SIMULATED TRADING PROGRAMS IN GENERAL ARE ALSO SUBJECT TO THE FACT THAT THEY ARE DESIGNED WITH THE BENEFIT OF HINDSIGHT. NO REPRESENTATION IS BEING MADE THAT ANY ACCOUNT WILL OR IS LIKELY TO ACHIEVE PROFIT OR LOSSES SIMILAR TO THOSE SHOWN.